Gander is a
seller’s market.
121 homes sold in Gander through September at a median $335,000 — 2% fewer sales than last year, prices flat, about 43 days to sell. With 4.0 months of supply, well-priced homes are moving.
Gander recorded 17 MLS® sales in September 2026 at a median price of $295,000 — well ahead of the 11 sales of September 2025.
Through September, 121 homes have sold (MLS® resale, all brokerages), roughly even with last year's pace, and the average sale price of $341,212 is essentially flat against the same period in 2025.
If you’re selling: In the last 24 months, homes that sold in the first four weeks averaged 99.8% of asking (155 sales). Homes that took 13 weeks or more averaged 88.7% (54 sales). The difference is 11.1 percentage points, about $44,000 on a $400K home. These are different groups of homes, so it is not a loss to any one seller.
Median = the middle sale; the average ($341,212) is pulled up by the biggest sales. Resale only — 23 new-build sales counted separately below.

The Turner Realty Team
Everyone on the Turner Realty Team works the Gander market — over 100 years of combined Central Newfoundland experience.
Gander
2026 Snapshot · Jan–Sep · resale
Latest reported — September 2026: 17 sales, median $295K.
Based on MLS® System data owned by the Newfoundland and Labrador Association of REALTORS® covering the period Jan 1, 2026 through Sep 30, 2026.
Months of supply is how long it would take to sell every home currently for sale at the recent pace of sales. Under 5 months is a seller's market — tight supply, firm prices. 7 months or more favours buyers. Gander is in seller's-market territory. Listing counts are current as of October 11, 2026.
Is Gander
Shifting?
Sales-to-new-listings ratio, month by month — under 40% favours buyers, over 60% favours sellers. This is a new measure we started tracking in May 2026, so it gains one more month every month rather than showing a full year at once.
These arrows compare this year to the same period last year. The comparison uses the exact same calendar window (e.g., Jan 1 – May 30 both years) so the comparison is fair.
September 2026 vs. September 2025.
A single month is a small sample, so treat this as a snapshot rather than a trend — the year-to-date and 10-year numbers below are the steadier read. It is here because it is the freshest picture of what buyers and sellers are doing right now.
September 2026 in plain language.
Gander recorded 17 MLS® sales in September 2026 at a median price of $295,000 — well ahead of the 11 sales of September 2025.
Year to date, 124 homes have sold (MLS® resale, all brokerages), behind last year's pace, and the average sale price of $340,235 is essentially flat against the same period in 2025.
Homes that sold in September averaged 38.4 days on market, faster than a year ago.
With 53 homes on the market and 4.0 months of supply, Gander sits in seller's-market territory.
Buyers took up 100% of the new listings that came to market over the last three months, seller's market conditions on the standard CREA measure.
Recent Closings
in Gander.
A few of the homes that changed hands in September 2026 — real closings, straight from the MLS® record.
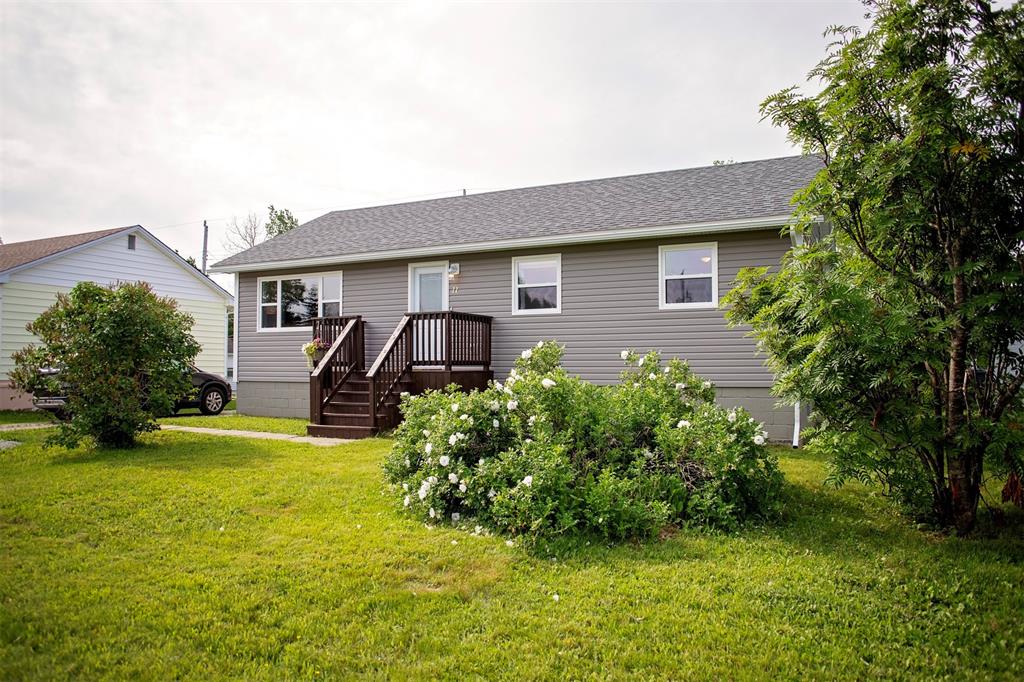
11 Cotton Street, Gander
3 bed · 1.5 bath · Detached,Bungalow
Listed at $340,000 · Sold in 21 days on market
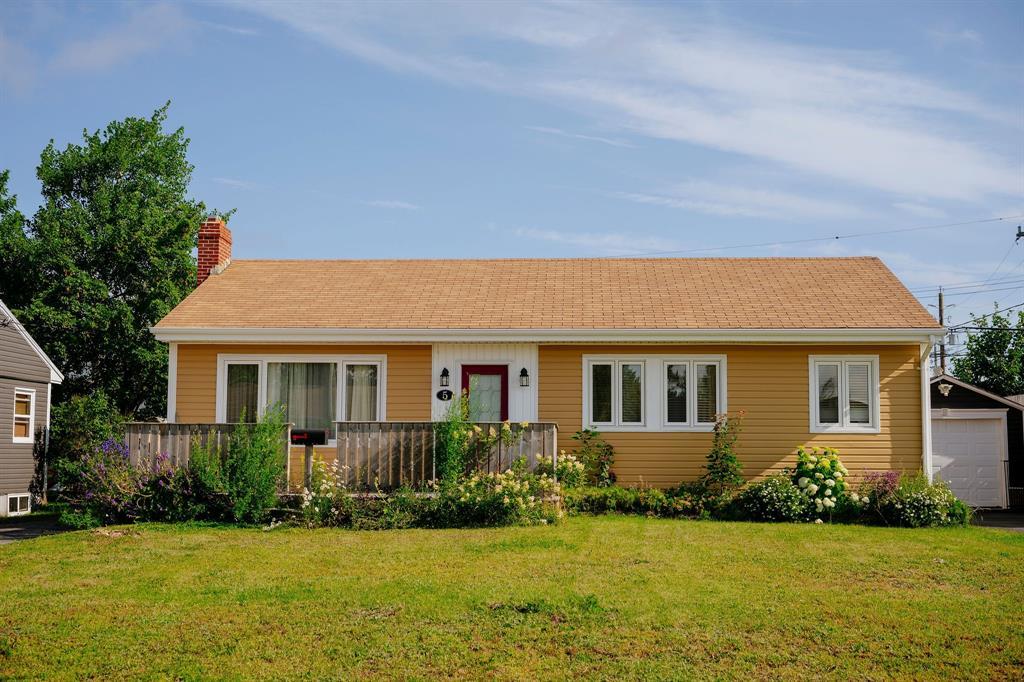
5 Alcock Crescent, Gander
2 bed · 2 bath · Detached,Bungalow
Listed at $259,000 · Sold in 28 days on market
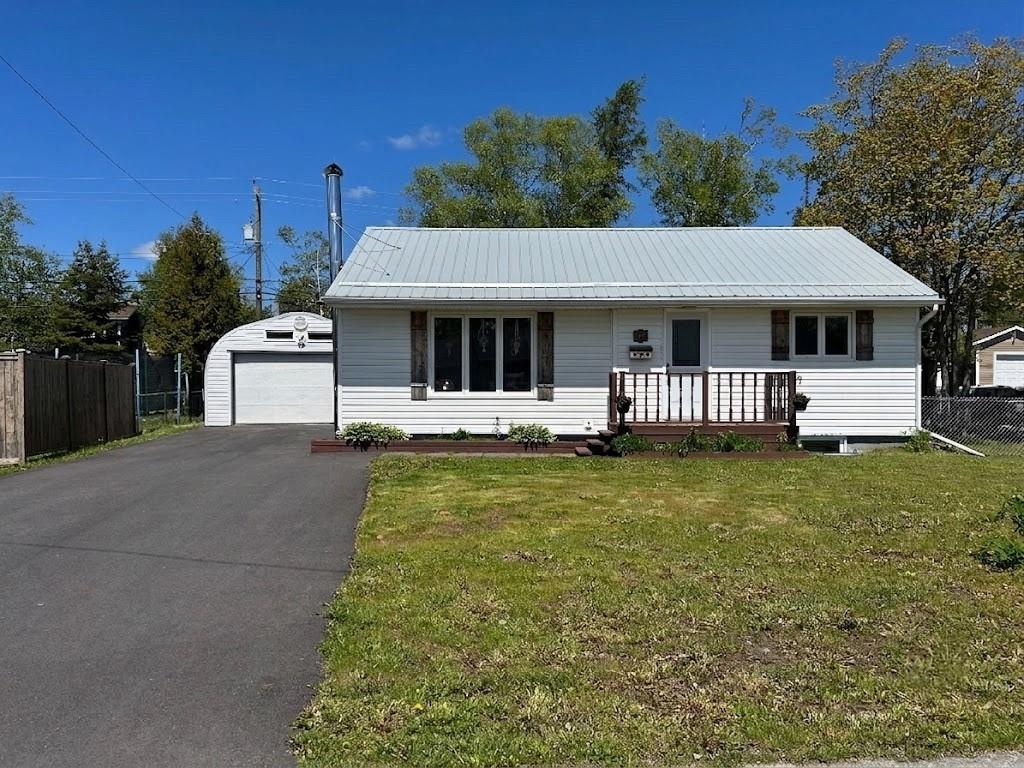
34 Nungesser Avenue, Gander
3 bed · 2 bath · Detached,Bungalow
Listed at $320,000 · Sold in 49 days on market
Want to see what homes like these actually sold for? Register free to unlock full sale prices, sale-to-list ratios, and price history for every closing in Gander.
See Full Sold PricesEvery Community
Side by Side.
Year-to-date results for each community we serve. Click any community for its full market page. Price per square foot uses the last 12 months of resale homes that recorded a floor area, and every figure shows how many sales it is built on.
| Community | Sales YTD | Median Price | $ / Sq Ft · Median | Typical Size | Avg Days on Market | Market Type |
|---|---|---|---|---|---|---|
| Gander & Area | 124 | $332,500 | $16585 sales | 2,000 sq ft | 43.6 | Seller's Market |
| Lewisporte | 68 | $183,500 | $12748 sales | 1,538 sq ft | 63.2 | Buyer's Market |
| The Gander Loop | 28 | $129,000 | $7623 sales | 1,622 sq ft | 100.0 | Buyer's Market |
| Notre Dame Bay | 23 | $140,000 | $11414 sales | 1,487 sq ft | 51.7 | Buyer's Market |
| Twillingate | 22 | $177,500 | $8214 sales | 1,204 sq ft | 69.2 | Buyer's Market |
| Glovertown | 19 | $135,000 | $98Limited · 9 sales | 1,205 sq ft | 98.6 | Buyer's Market |
| Gambo | 11 | $160,000 | $140Limited · 6 sales | 1,548 sq ft | 63.8 | Small market |
| Appleton & Glenwood | 8 | $266,000 | $126Limited · 7 sales | 2,280 sq ft | 85.0 | Buyer's Market |
| Eastport | 8 | $277,000 | $129Limited · 5 sales | 1,976 sq ft | 31.1 | Small market |
| Fogo Island | 2 | $98,750 | Too few sales with a floor area | — | 217.0 | Small market |
10 or more sales with a floor area5 to 9 sales: read as direction, not precisionUnder 5: not shown
How to read price per square foot
It levels out size. A large home and a small home can be compared on the same footing, which a median price alone cannot do.
It counts finished floor area only. Land, water frontage, garages and unfinished basements are in the price but not the square footage, so acreage and waterfront homes read high.
It is not a pricing formula. Smaller homes sell for more per square foot than larger ones. Use it to compare communities, then ask for a proper evaluation.
Year-to-date figures for each community. Smaller communities trade only a handful of homes a year, so their numbers swing much more than Gander's — read them as direction, not precision.
Sales by Price Range.
How many homes sold in each price bracket, and how that mix compares to the year before.
Twelve months of sales rather than one, because a single month split five ways would be too few sales in each band to mean anything. Watch the share column: a band growing year over year is where demand is moving.
New builds, counted separately.
Every other number on this page is a resale. New construction — homes sold within a year of being built, or listed as new, under construction or to be built — is shown here on its own (January–September 2026), so the two markets never blur into one average.
What Kind of Homes Are Selling.
The homes that changed hands over the last twelve months, cut three ways — by property type, by style of house, and by bedroom count.
| Property Type | Sales | Share | Median Price | Median Beds | Typical Size | $ / Sq Ft · Median | Avg Days on Market |
|---|---|---|---|---|---|---|---|
| Single-Family | 139 | 90% | $315,000 | 3 | 2,000 sq ft | $16569 sales | 45.5 |
| Multi-Family | 16 | 10% | $382,000 | 5 | 2,588 sq ft | $16412 sales | 56.9 |
Trailing 12 months · 155 sales · 8 in groups too small to report · typical size and $/sq ft use only the sales that recorded a floor area
Price per Square Foot, by Home Style
Bar = the middle half of sales · white tick = medianSmaller homes almost always cost more per square foot than larger ones, so compare a style against itself over time before comparing it to another style.
By Home Style
Most of what trades here is detached single-family, so the style of house is the split that actually separates one seller's market from another's.
| Home Style | Sales | Share | Median Price | Median Beds | Typical Size | $ / Sq Ft · Median | Avg Days on Market |
|---|---|---|---|---|---|---|---|
| Bungalow | 71 | 57% | $303,300 | 3 | 1,970 sq ft | $15933 sales | 44.6 |
| Split Entry | 26 | 21% | $392,500 | 4 | 2,258 sq ft | $16415 sales | 33.6 |
| 2-Storey | 16 | 13% | $427,000 | 4 | 2,500 sq ft | $16813 sales | 73.4 |
| 1.5-Storey | 12 | 10% | $244,250 | 3 | 1,450 sq ft | $176Limited · 5 sales | 48.5 |
Trailing 12 months · 125 sales · 25 more had no home style recorded · 8 in groups too small to report · typical size and $/sq ft use only the sales that recorded a floor area
By Bedroom Count
| Bedrooms | Sales | Share | Median Price | Typical Size | $ / Sq Ft · Median | Avg Days on Market |
|---|---|---|---|---|---|---|
| 3 Bedroom | 79 | 50% | $295,000 | 1,800 sq ft | $17137 sales | 53.1 |
| 4 Bedroom | 36 | 23% | $339,750 | 2,300 sq ft | $15821 sales | 50.0 |
| 5+ Bedroom | 23 | 15% | $405,500 | 2,588 sq ft | $16216 sales | 46.5 |
| 2 Bedroom | 19 | 12% | $220,000 | 1,298 sq ft | $193Limited · 8 sales | 32.2 |
Trailing 12 months · 157 sales · 1 more had no bedrooms recorded · typical size and $/sq ft use only the sales that recorded a floor area
Median price is used here rather than average so one unusually expensive sale does not distort a small category. Property types with fewer than five sales in the past year are left out entirely.
2025 vs. 2026
By the Numbers.
Month-by-month comparison across all key metrics for Gander.
Seasonal patterns in the market. In Central NL, the busiest months are typically May–September (spring/summer listing season). Winter months are slower. Knowing this helps time your listing or purchase.
Is a Square Foot
Getting More Expensive?
Median sold price per square foot, Gander, tracked as a rolling 12-month figure so one unusually large or small sale doesn't swing the whole trend.
Rolling 12-month median · 23 months · 1 month on a limited sample (5–9 sales)
Days on Market and
Sale Price.
In the last 24 months (Gander data), homes that sold in the first four weeks closed at an average of 99.8% of asking, across 155 sales. Homes that took 13 weeks or more closed at an average of 88.7%, across 54 sales.
The gap is 11.1 percentage points between the two sale-to-list ratios, or about $44,000 on a $400,000 home. This compares two different groups of homes. They differ in condition, type, location and starting price, so the gap is not a loss to any one seller.
Each figure is a percentage of the asking price, so the gap is stated in percentage points. Homes that took 13 weeks or more sold at an average of 88.7% of asking, 11.3 percentage points under asking.
Ask us for the recent sales near you before you set a price.
This is what the Gander data shows, updated every month.
| Time on Market | Avg S/A Ratio | Vs asking |
|---|---|---|
| Week 1 | 101.77% | Above asking |
| Week 2 | 100.55% | Above asking |
| Week 3 | 99.84% | Near asking |
| Week 4 | 99.24% | Near asking |
| Week 5 | 97.80% | Near asking |
| Week 6 | 95.66% | Below asking |
| Week 7 | 95.57% | Below asking |
| Week 8 | 96.59% | Below asking |
| Week 9 | 90.74% | Below asking |
| Week 10 | 93.62% | Below asking |
| Week 11 | 94.18% | Below asking |
| Week 12 | 91.83% | Below asking |
| Week 13+ | 88.68% | Below asking |
Homes that sold in the first four weeks averaged 99.8% of asking. Homes that took 13 weeks or more averaged 88.7%. On a $400,000 home that gap is about $44,000. These are different homes, so this describes a pattern in the data, not what any one sale would have done.
Homes that took 13 weeks or more closed at an average of 88.7% of asking, 11.3 percentage points under asking. Long-listed homes are where buyers often have the most room to negotiate. Every home is different, so check its own recent sales.
How Fast Homes Sell, and For How Much.
An average hides two very different groups: the homes that sell in days and the ones that sit. 163 Gander resale homes sold in the last twelve months, split by how long they took and how the sold price compared with the asking price.
How fast do homes really sell?
From Oct 1, 2025 to Oct 1, 2026, homes that sold in 2 weeks or less went for 101.5% of asking. Homes that took over 60 days to sell went for 90.3%.
Are sellers getting their asking price?
41% of sellers lowered their price before selling, by a median of $25,000. Those homes took 69 days longer to sell.
Trailing 12 months · residential resale · sold price against the last asking price · shares only, no individual sale prices
Sale Prices and Sales
in Gander.
Average sale price and total residential sales from 2016 through early 2026 (2026 is year to date, a partial year).
| Year | Avg Sale Price | Sales | Price Change |
|---|---|---|---|
| 2016 | $228,130 | 98 | — |
| 2017 | $259,811 | 116 | +13.9% |
| 2018 | $237,152 | 117 | -8.7% |
| 2019 | $235,334 | 123 | -0.8% |
| 2020 | $258,196 | 138 | +9.7% |
| 2021 | $266,357 | 218 | +3.2% |
| 2022 | $324,262 | 224 | +21.7% |
| 2023 | $305,688 | 172 | -5.7% |
| 2024 | $333,510 | 146 | +9.1% |
| 2025 | $326,606 | 165 | -2.1% |
| 2026 YTD | $340,235 | 124 | +4.2% |
How the market has evolved over a full decade. Long-term trends matter more than any single year — look for the direction, not the individual number.
The total number of homes that closed during this period. More sales generally indicate a healthier, more active market.
Gander in six questions.
Is Gander a buyer's or seller's market right now?
Gander is currently a seller's market: 53 homes are for sale and the market has been absorbing about 13 a month, which is roughly 4.0 months of supply. Under 5 months of supply favours sellers; 7 or more favours buyers.
What is the median home price in Gander?
The median sale price in Gander is $335,000 (January through September 2026, NLAR MLS® residential sales), and the average sale price is $341,212. The median is the middle sale, so one unusually expensive home doesn't distort it.
How long does it take to sell a home in Gander?
Homes in Gander have averaged 43 days on the market before selling (January through September 2026). In September 2026 alone the average was 38 days.
How many homes have sold in Gander this year?
121 homes sold in Gander January through September 2026 (MLS® resale, all brokerages), compared with 123 over the same window a year earlier.
How much new construction is selling in Gander?
23 newly built homes sold in Gander January through September 2026 — about 16% of all residential sales there, at a median price of $450,000. The headline statistics on this page are resale only; new construction (homes sold within a year of being built, or listed as new, under construction or to be built) is counted separately.
Where do the Gander market statistics come from?
Every figure on this page is computed from the Newfoundland and Labrador Association of REALTORS® MLS® System (residential sales), refreshed daily by Royal LePage Turner Realty. Recent months keep filling in as sold notices are processed, so the latest month is always shown as 'reported so far'.
- Average Sale Price
- The average price buyers paid for homes. This includes all residential property types — single-family, lots, and multi-family. For a more specific comparison, consider filtering by property type.
- Median vs. Average
- The median is the middle sale — half sold for more, half for less — and it shrugs off one unusually expensive home. The average adds every sale and divides, so a single high sale in a small community can pull it up sharply. In small markets, trust the median.
- Sale-to-List Ratio
- Measures how close homes sell to their asking price. 100% means sellers get exactly what they ask. Above 100% suggests multiple offers (seller's market). Below 95% means buyers have negotiating room.
- Days on Market
- How long the typical home sits before selling. Under 30 days is fast-moving (favours sellers). Over 90 days is slower (favours buyers). This helps set realistic expectations for listing or offer timing.
- Sold at 100%+ Asking
- Homes that sold at or above the listed price. A high number here means multiple-offer situations are common — buyers should be prepared to compete.
- Months of Supply
- How long it would take to sell every home currently listed at the recent pace of sales — active listings divided by average monthly sales over the last 12 months. Under 5 months is a seller's market, 5–7 balanced, 7 or more a buyer's market. In small communities a couple of listings can swing it, so the verdict is withheld below 15 sales a year.
- Sales-to-New-Listings Ratio
- Homes sold in a month as a share of homes newly listed that month — the CREA measure of whether demand is keeping up with fresh supply. Under 40% favours buyers, over 60% favours sellers. Shown as a rolling three-month figure because a single month swings on a handful of sales.
- New Construction vs. Resale
- Every headline figure here is a resale. A sale counts as new construction when the home sold within a year of being built, or was listed as new, under construction or to be built; those sales are shown on their own in the What's Selling section so a new-build premium never inflates the resale median.
- Price per Square Foot
- The sold price divided by the home's finished floor area, shown as the median across recent resale homes. It lets you compare communities and styles of house without size getting in the way. Only about half of listings record a floor area, so every figure says how many sales it is built on; 5 to 9 sales is flagged as limited, and under 5 is not shown. Land, waterfront and garages are in the price but not the square footage.
- Full real estate glossary →
- 100+ plain-English terms for buying, selling and reading the market in Newfoundland & Labrador.
Newfoundland & Labrador MLS® Home Price Index
The official benchmark price index for our market, maintained by NLAR and CREA. Explore 20-year price history and compare neighbourhood benchmarks.

Data: MLS® Home Price Index via NLAR and CREA. View on Tableau Public →
Prefer to browse it region by region and town by town? Our own NL Housing Market Data page breaks down median sale prices for every region and community in Newfoundland and Labrador, updated nightly.
Know What Your Home Is Worth.
Whether you're thinking of selling, buying, or just curious about your property's value — our team provides honest, data-backed evaluations.