
Gander Real Estate Market Data.
Current stats, historic trends, and new construction data — everything you need to understand where the Gander market has been and where it's going. Updated quarterly with data from the Newfoundland & Labrador Association of REALTORS® and CMHC.
Gander Real Estate Market Report.
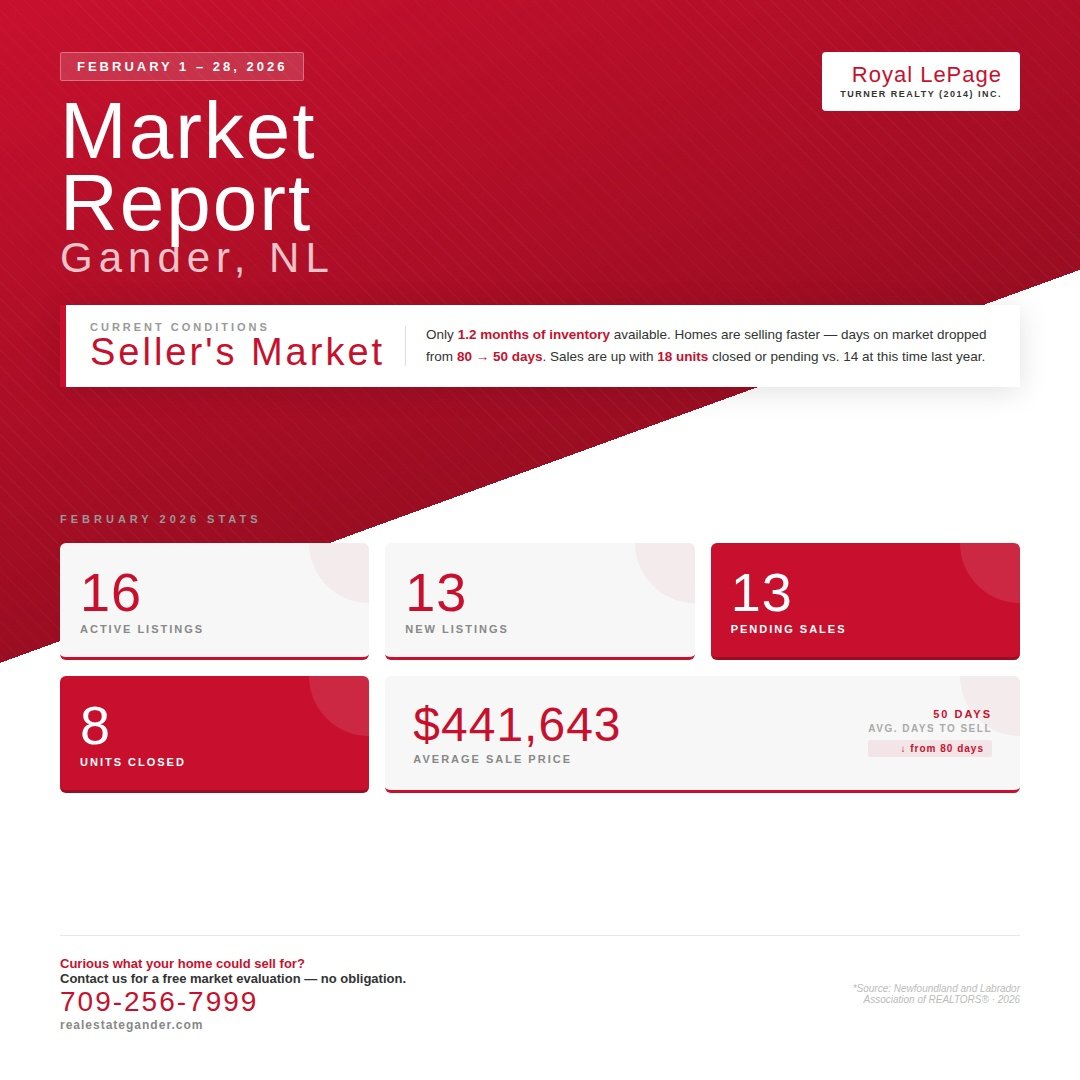
The Gander real estate market delivered a strong and consistent performance throughout 2025, reinforcing Central Newfoundland's reputation as one of Atlantic Canada's most stable and affordable housing markets. From first-time buyers putting down roots to families upsizing and relocators discovering everything Gander has to offer, demand remained healthy from January through December.
178 residential units were sold across the Gander market in 2025, generating a total sales volume of $63,904,324. For a community of Gander's size, that level of activity speaks to genuine, broad-based demand — not speculative buying or seasonal spikes.
The average sale price for 2025 was $359,013, with a median sale price of $359,500. The near-identical average and median figures are telling: Gander's market is exceptionally consistent, with values distributed evenly across the price spectrum rather than being pulled by a small number of high-end sales. For buyers, that means predictable, fair-value pricing. For sellers, it means the market will reward a well-priced home.
Homes sold at a sale-to-list price ratio of 97.95% — just over two percent below asking on average. Sellers who priced strategically and marketed their homes professionally achieved results at or above that benchmark. Those who didn't felt the gap.
The average days on market across 2025 was 62.6 days — roughly nine weeks from listing to accepted offer. That's a pace that reflects a healthy, balanced market. Properties that were priced right and presented well moved faster. Properties that sat beyond the average almost universally had a pricing or marketing issue, not a demand issue.
Exceptional Value, But Move Quickly
Gander continues to offer exceptional value relative to virtually every other market in Atlantic Canada. With an average sale price of $359,013 and a market that moves at a measured pace, buyers have real opportunity here — but the window on well-priced properties closes quickly. Come into 2026 pre-approved, clear on your priorities, and with a team that knows the inventory before it hits the public market.
Strategy Matters More Than Ever
2025 proved that the Gander market rewards sellers who do things right. A 97.95% sale-to-list ratio is achievable — but it requires accurate pricing, professional photography and video, and maximum market exposure from day one. If your home sat unsold in 2025, the market wasn't the issue. Strategy was. 2026 is a fresh opportunity to do it differently.
Gander Housing Starts — 35-Year Trend.
New housing construction data from 1990 to 2025. Source: CMHC Starts and Completions Survey, all intended markets.
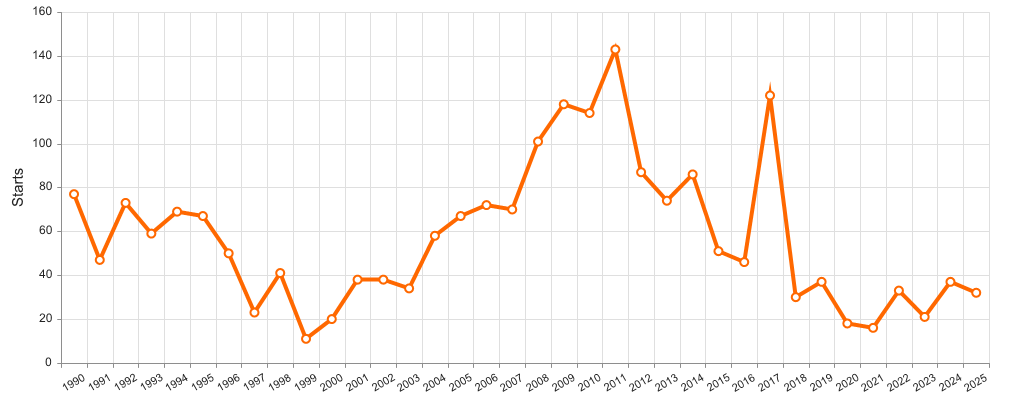
New housing construction in Gander held steady in 2025, with 32 total housing starts recorded across all dwelling types — comprising 22 single-detached, 2 semi-detached, and 8 apartment units. That figure is broadly consistent with 2024's 37 starts and continues a period of measured, sustainable construction activity that has defined the Gander market since 2020.
Putting 2025 in Historical Context
Gander's new construction story is one of the most revealing in the province when viewed across 35 years of CMHC data. The market peaked in the late 2000s — 101 total starts in 2008 and 118 in 2009 — fuelled by strong single-detached demand and a period of real economic confidence in Central Newfoundland. Before that, a dramatic earlier peak saw 77 starts in 1990, followed by a sharp decline through the 1990s as Newfoundland's broader economic challenges took hold. By 1999, starts had fallen to just 11 units — a historic low.
The recovery was gradual. The mid-2000s brought renewed momentum, peaking with that 2008–2009 surge before settling into a more moderate pattern through the 2010s. 2017 stands out as a notable outlier — 122 starts, driven almost entirely by a spike in row housing (42 units) and semi-detached construction (36 units) that hasn't been repeated since.
Since 2020, annual starts have ranged between just 16 and 37 units per year — a disciplined, demand-matched pace that reflects a mature, stable market rather than speculative overbuilding. The 2025 figure of 32 sits comfortably within that range.
Notably, apartment construction returned in 2025 with 8 units after two consecutive years of zero apartment starts in 2023 and 2024. This modest uptick may signal early renewed developer interest in multi-unit housing — worth watching heading into 2026.
| Year | Single | Semi | Row | Apt | Total |
|---|---|---|---|---|---|
| 2025 | 22 | 2 | 0 | 8 | 32 |
| 2024 | 29 | 6 | 0 | 2 | 37 |
| 2023 | 16 | 0 | 0 | 0 | 16 |
| 2022 | 19 | 2 | 0 | 0 | 21 |
| 2021 | 26 | 6 | 0 | 0 | 32 |
| 2020 | 24 | 4 | 4 | 0 | 32 |
| 2019 | 20 | 8 | 0 | 0 | 28 |
| 2018 | 26 | 14 | 0 | 0 | 40 |
| 2017 | 34 | 36 | 42 | 10 | 122 |
| 2016 | 18 | 16 | 0 | 0 | 34 |
| 2015 | 23 | 14 | 0 | 14 | 51 |
| 2014 | 30 | 20 | 0 | 0 | 50 |
| 2013 | 35 | 14 | 0 | 0 | 49 |
| 2012 | 28 | 4 | 0 | 12 | 44 |
| 2011 | 36 | 12 | 0 | 0 | 48 |
| 2010 | 54 | 16 | 0 | 0 | 70 |
| 2009 | 76 | 22 | 0 | 20 | 118 |
| 2008 | 73 | 28 | 0 | 0 | 101 |
| 2007 | 43 | 14 | 0 | 0 | 57 |
| 2006 | 33 | 10 | 0 | 0 | 43 |
| 2005 | 26 | 8 | 0 | 0 | 34 |
| Source: CMHC Starts and Completions Survey · Compiled by Turner Realty, Gander NL | |||||
Engage Early on New Builds
New construction supply in Gander is intentionally limited — 32 starts means 32 new homes entering the pipeline, and not all will be available for open-market purchase. Buyers interested in new construction should engage early and work with an agent who has established builder relationships and knows what's coming before it's publicly listed.
Limited Supply Works in Your Favour
Constrained new construction is good news for existing home sellers. With only 32 new builds entering the market in 2025, buyers seeking move-in-ready homes have limited new options — which sustains strong demand for quality resale properties. A well-maintained, professionally marketed existing home competes very favourably in this environment.
Know the Market. Own the Outcome.
Whether you're buying or selling in 2026, the Turner Realty Team gives you the most current and comprehensive market intelligence in Central Newfoundland — backed by the experience and results to act on it.
Get a Free Home EvaluationView important disclosures and notices about Royal LePage® trademarks at rlp.ca/notices.